MAY 2022 DENVER MARKET STATS
June 14, 2022 | denver-housing-market

June 14, 2022 | denver-housing-market

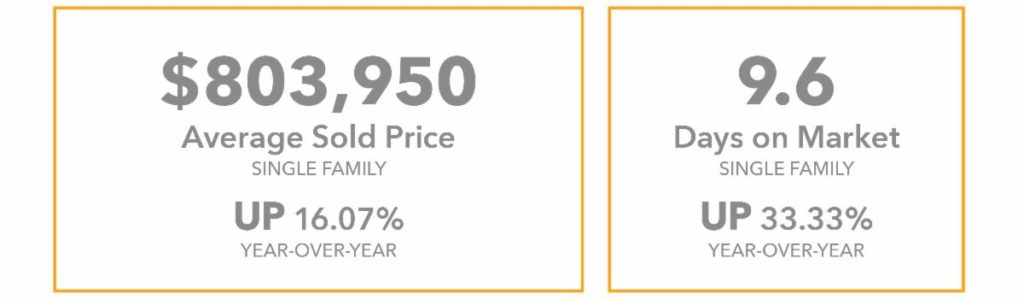
All comparisons made to May 2021
The past 10 years have been a wild ride in the real estate market. In February 2012, the average sales price in the Denver Market was $247,282, the average days on market was 85 days, and interest rates had dropped from 4.8% to 3.89% over the previous 12 months.
Since then, the Denver 7-county area has experienced a population growth of 17.2% to 2,897,000, driven by many factors, including sunshine, outdoor lifestyle, and economic diversity. Yet here we stand in June of 2022 with rising interest rates, 9% inflation, and $6/gallon gas, issues that will likely have a ripple effect on population migration, travel, labor markets and ultimately, real estate purchasing power and consumer confidence. A market shift is happening.


Denver (Metrolist) inventory hit 4,493 homes as of June 3, 2022. That’s the highest inventory level since October of 2020. While this could be interpreted as a slowdown in the market (which it is), it’s important to remember that a balanced real estate market the size of Denver requires 15,000 or more listings. So if you have been waiting for less competition, now is your time!

Showings have slowed markedly and correlate to the rise in interest rates. The year started with the 30-year fixed interest rate at approximately 3.2%, and buyer activity was very strong. However, rates rose rapidly between March 1 and April 15, and a surge in buyer activity peaked in the second week of April. As a result, mid-April this year saw a historically low 6.87 average days on market for new listings. In 6 weeks, that number has doubled to 13.5 days.
With a sharp decline in buyer activity, we will start seeing more price reductions, fewer offers, lower offers, and the nature of those offers changing. This will result in a longer marketing time for properties which will demand more communication, strategy, and partnership between us.

If you took advantage of the low interest rates and are watching the market from the comfort of the home you want to stay in for
The last 18 months have been wildly imbalanced, with interest rates through the floor and inventory historically low. This supply/demand ratio has driven out of control buyer behavior and off-the-charts historic home value appreciation.
But as those two factors, interest rates and inventory, shift, we see a ripple effect. In April 2022, we saw an incredible 78.6% of homes sell for more than the asking price, with only 11.9% selling below the asking price. Returning to February 2012, 15% were selling for more than the asking price, and 76.4% were selling for below.
As your consultant, we will continue to pay attention to market trends, monetary policy, and lead indicators of the economy. In addition, I will share stories of what I am seeing as the market continues to change and am here to answer any questions or discuss any concerns you may have about your home and what any of this means for you, specifically.
Share this Post